A little less than a year ago we discussed advantages and differences of two types of maps - bitmaps, used by Leaflet engine, and vector maps, used by Mapbox. The first are more common and consist of tiles (images), the second - the technology is more recent, running on binary codes, so the speed is higher. This year, we offer our clients Mapbox, which is connected to the Relog program, along with Leaflet. Let's go through their benefits.
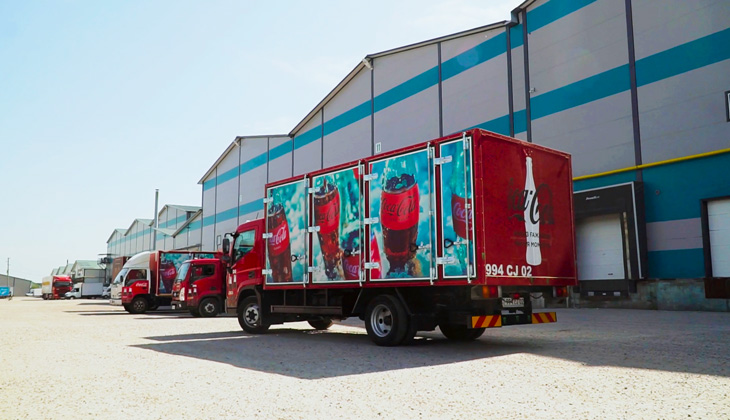
First, as already mentioned - vector maps are faster. Since tiles are very small, they are best suited to transmit information on objects. While bitmap images must be of a certain quality, they require greater space than the description of an object. Assume the driver of a beverage company has a delivery to the suburbs. As long as he uses a bitmap in the city, the tiles load well, as they are saved in his browser, but when he goes to the suburbs - to new territory for him - the map loads with "dabs", and he has to wait to see the whole terrain. But delivery is a rather dynamic process to waste precious time waiting. Vector maps run smoother, that is, in Mapbox the scale of maps zooms in and out without any problems or nerves.
Second, Mapbox does not run on Yandex.Maps and Google Maps, but on OpenStreetMap, open-source maps, and we also use our own Relog Maps. Mapbox functioning will not be affected if Yandex or Google maps are unavailable in certain territories for some subjective reasons.
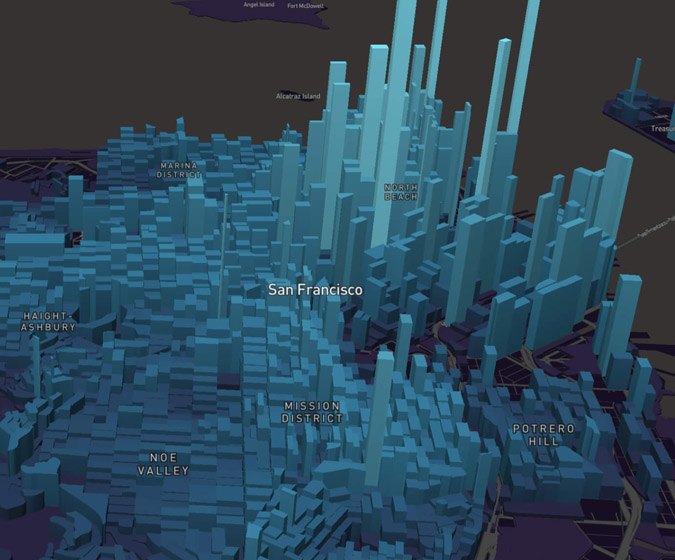
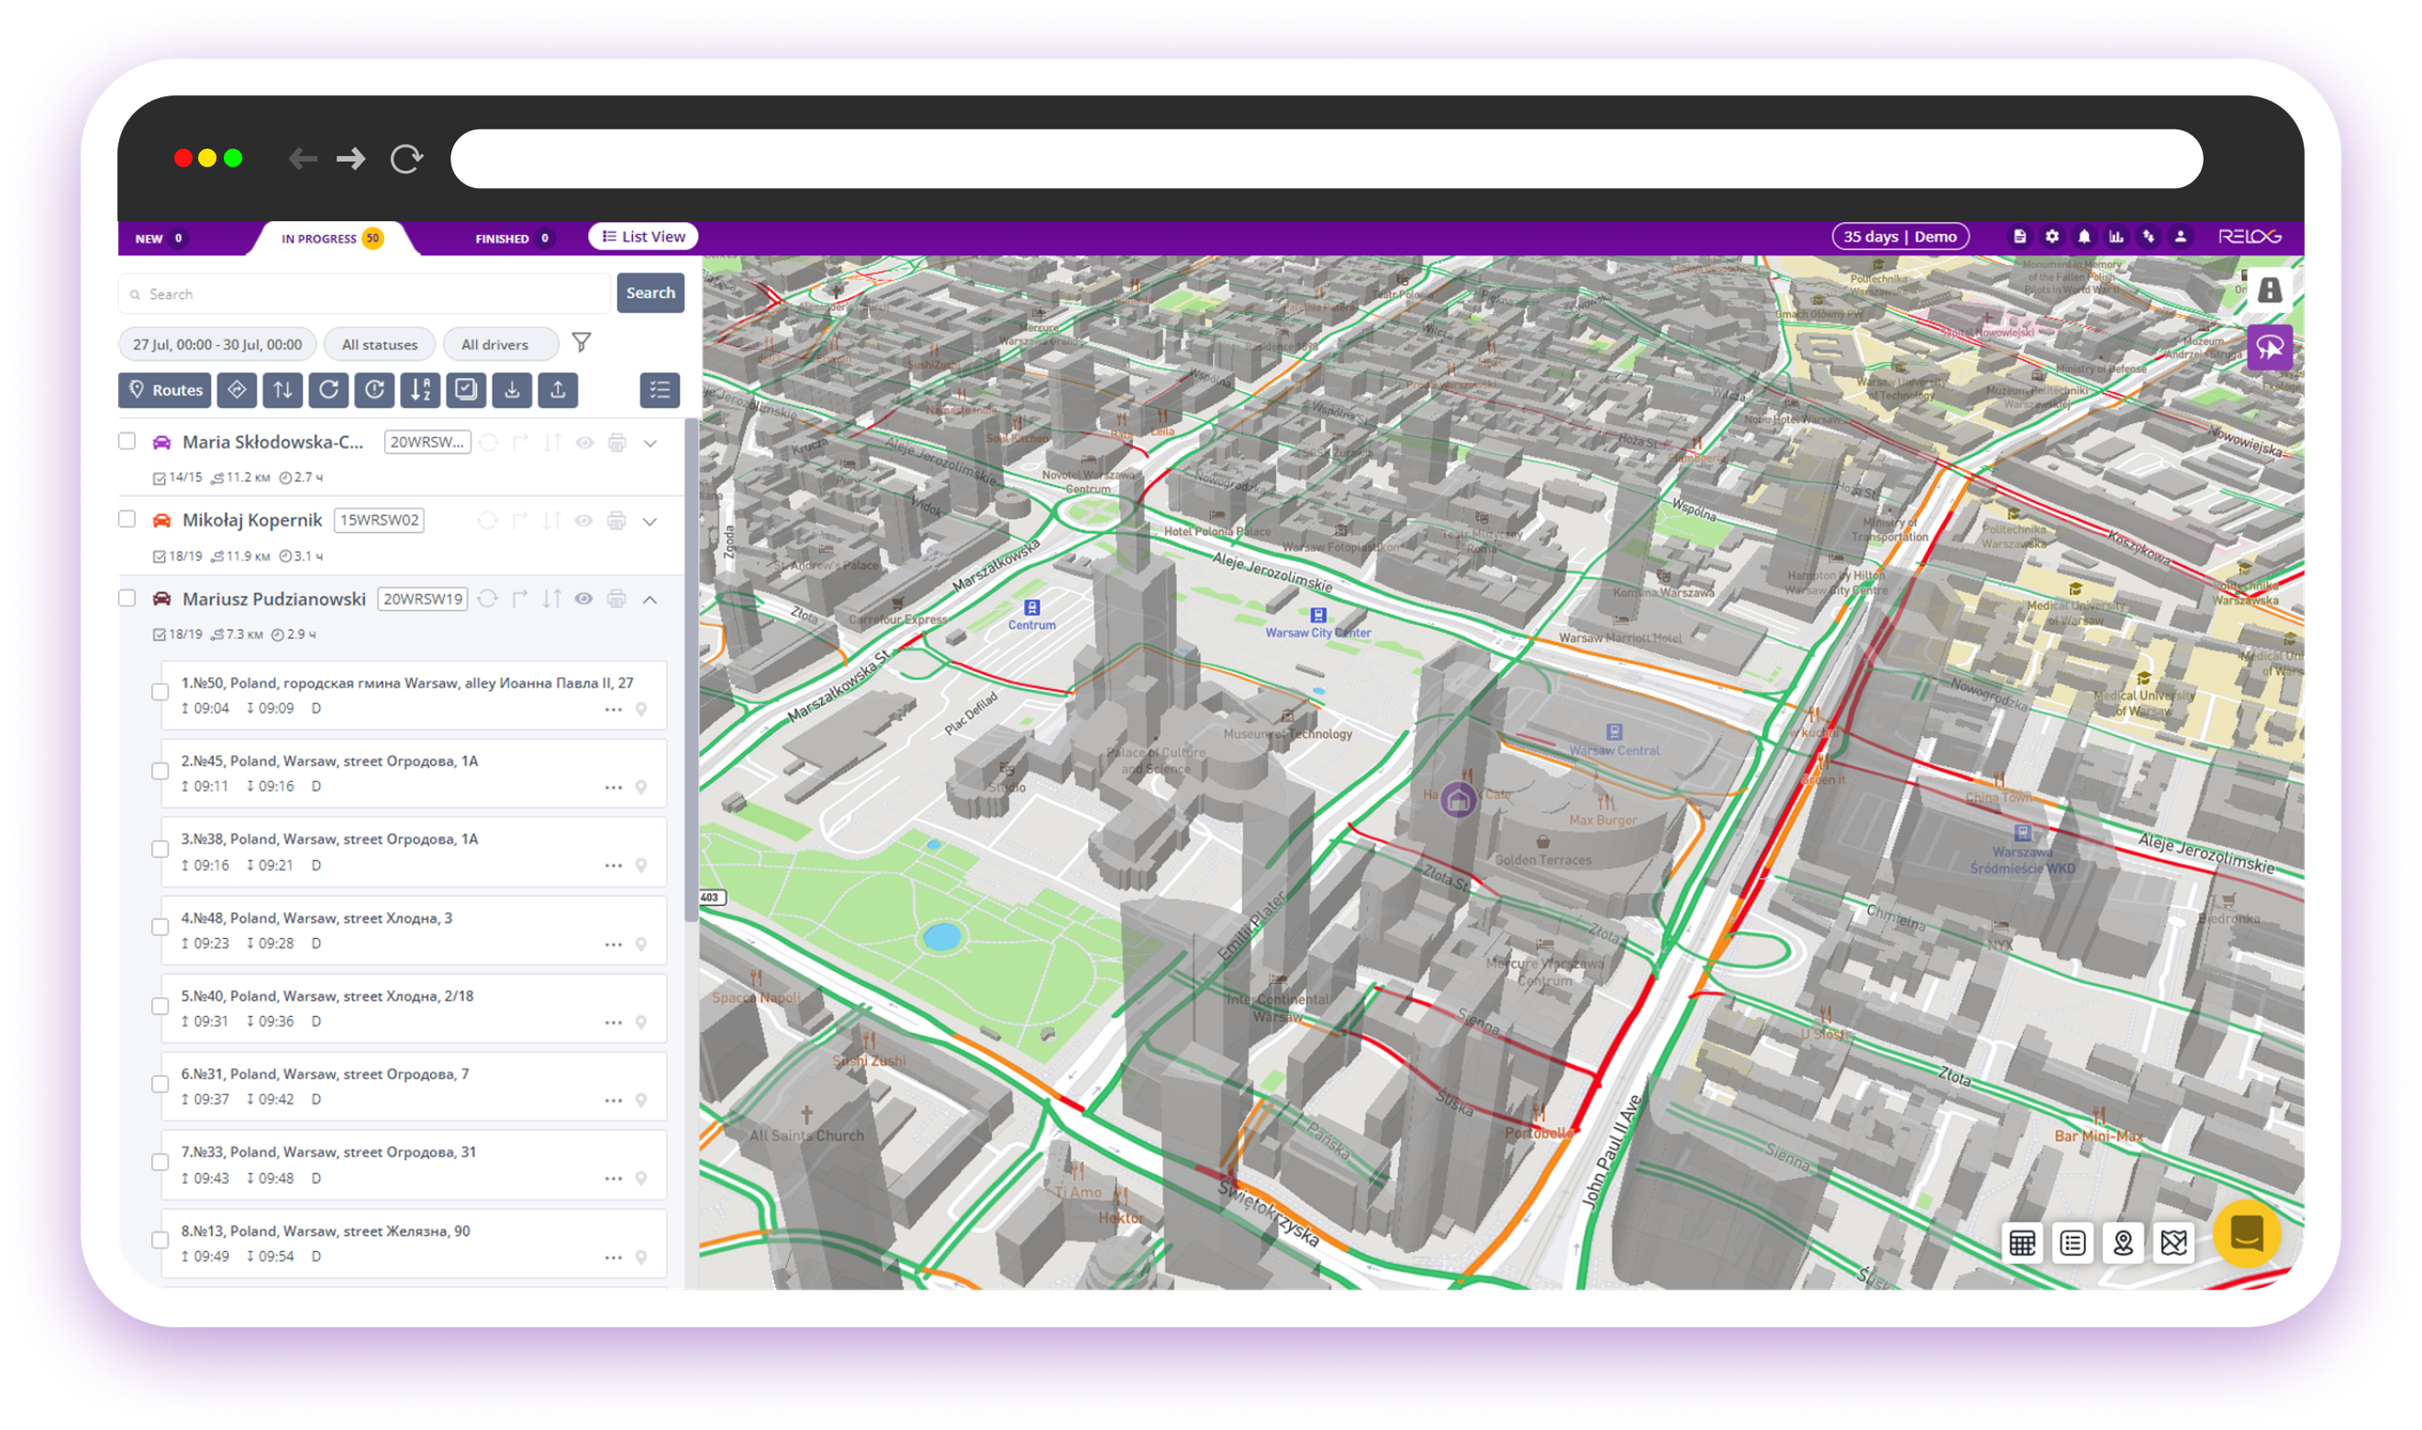
Third, since Mapbox has vector data on objects - shape, height, category, purpose, etc. - 3D maps may be created and this gives a number of possibilities. For example, with the map customizing, that is, coloring the actual objects (stores for distributors), it is possible:
- easily see only the objects you need;
- visually analyze the number of target sales outlets in the district or city;
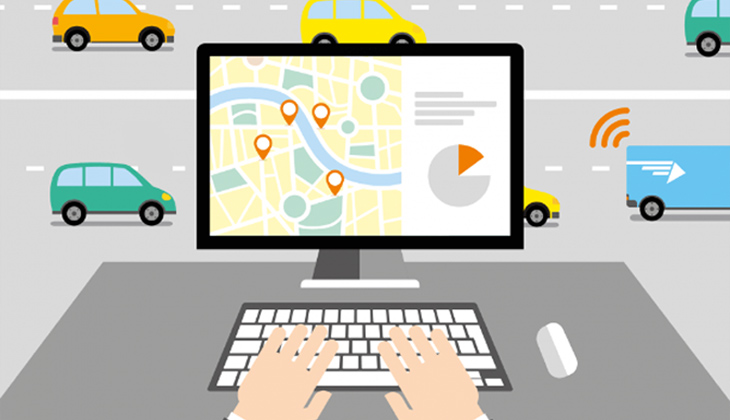
By creating a 3D model of the cars, you may also see what type of transport is where and by the "nose" of the car to see which direction it is moving.
Plus the vector map may be rotated to look at the object from different angles.